Reporting and AI
Reporting and dashboards
Ready-made occupancy, punctuality, delay, cost and vendor payment reports. Build your own with the report designer and export to Excel and PDF.
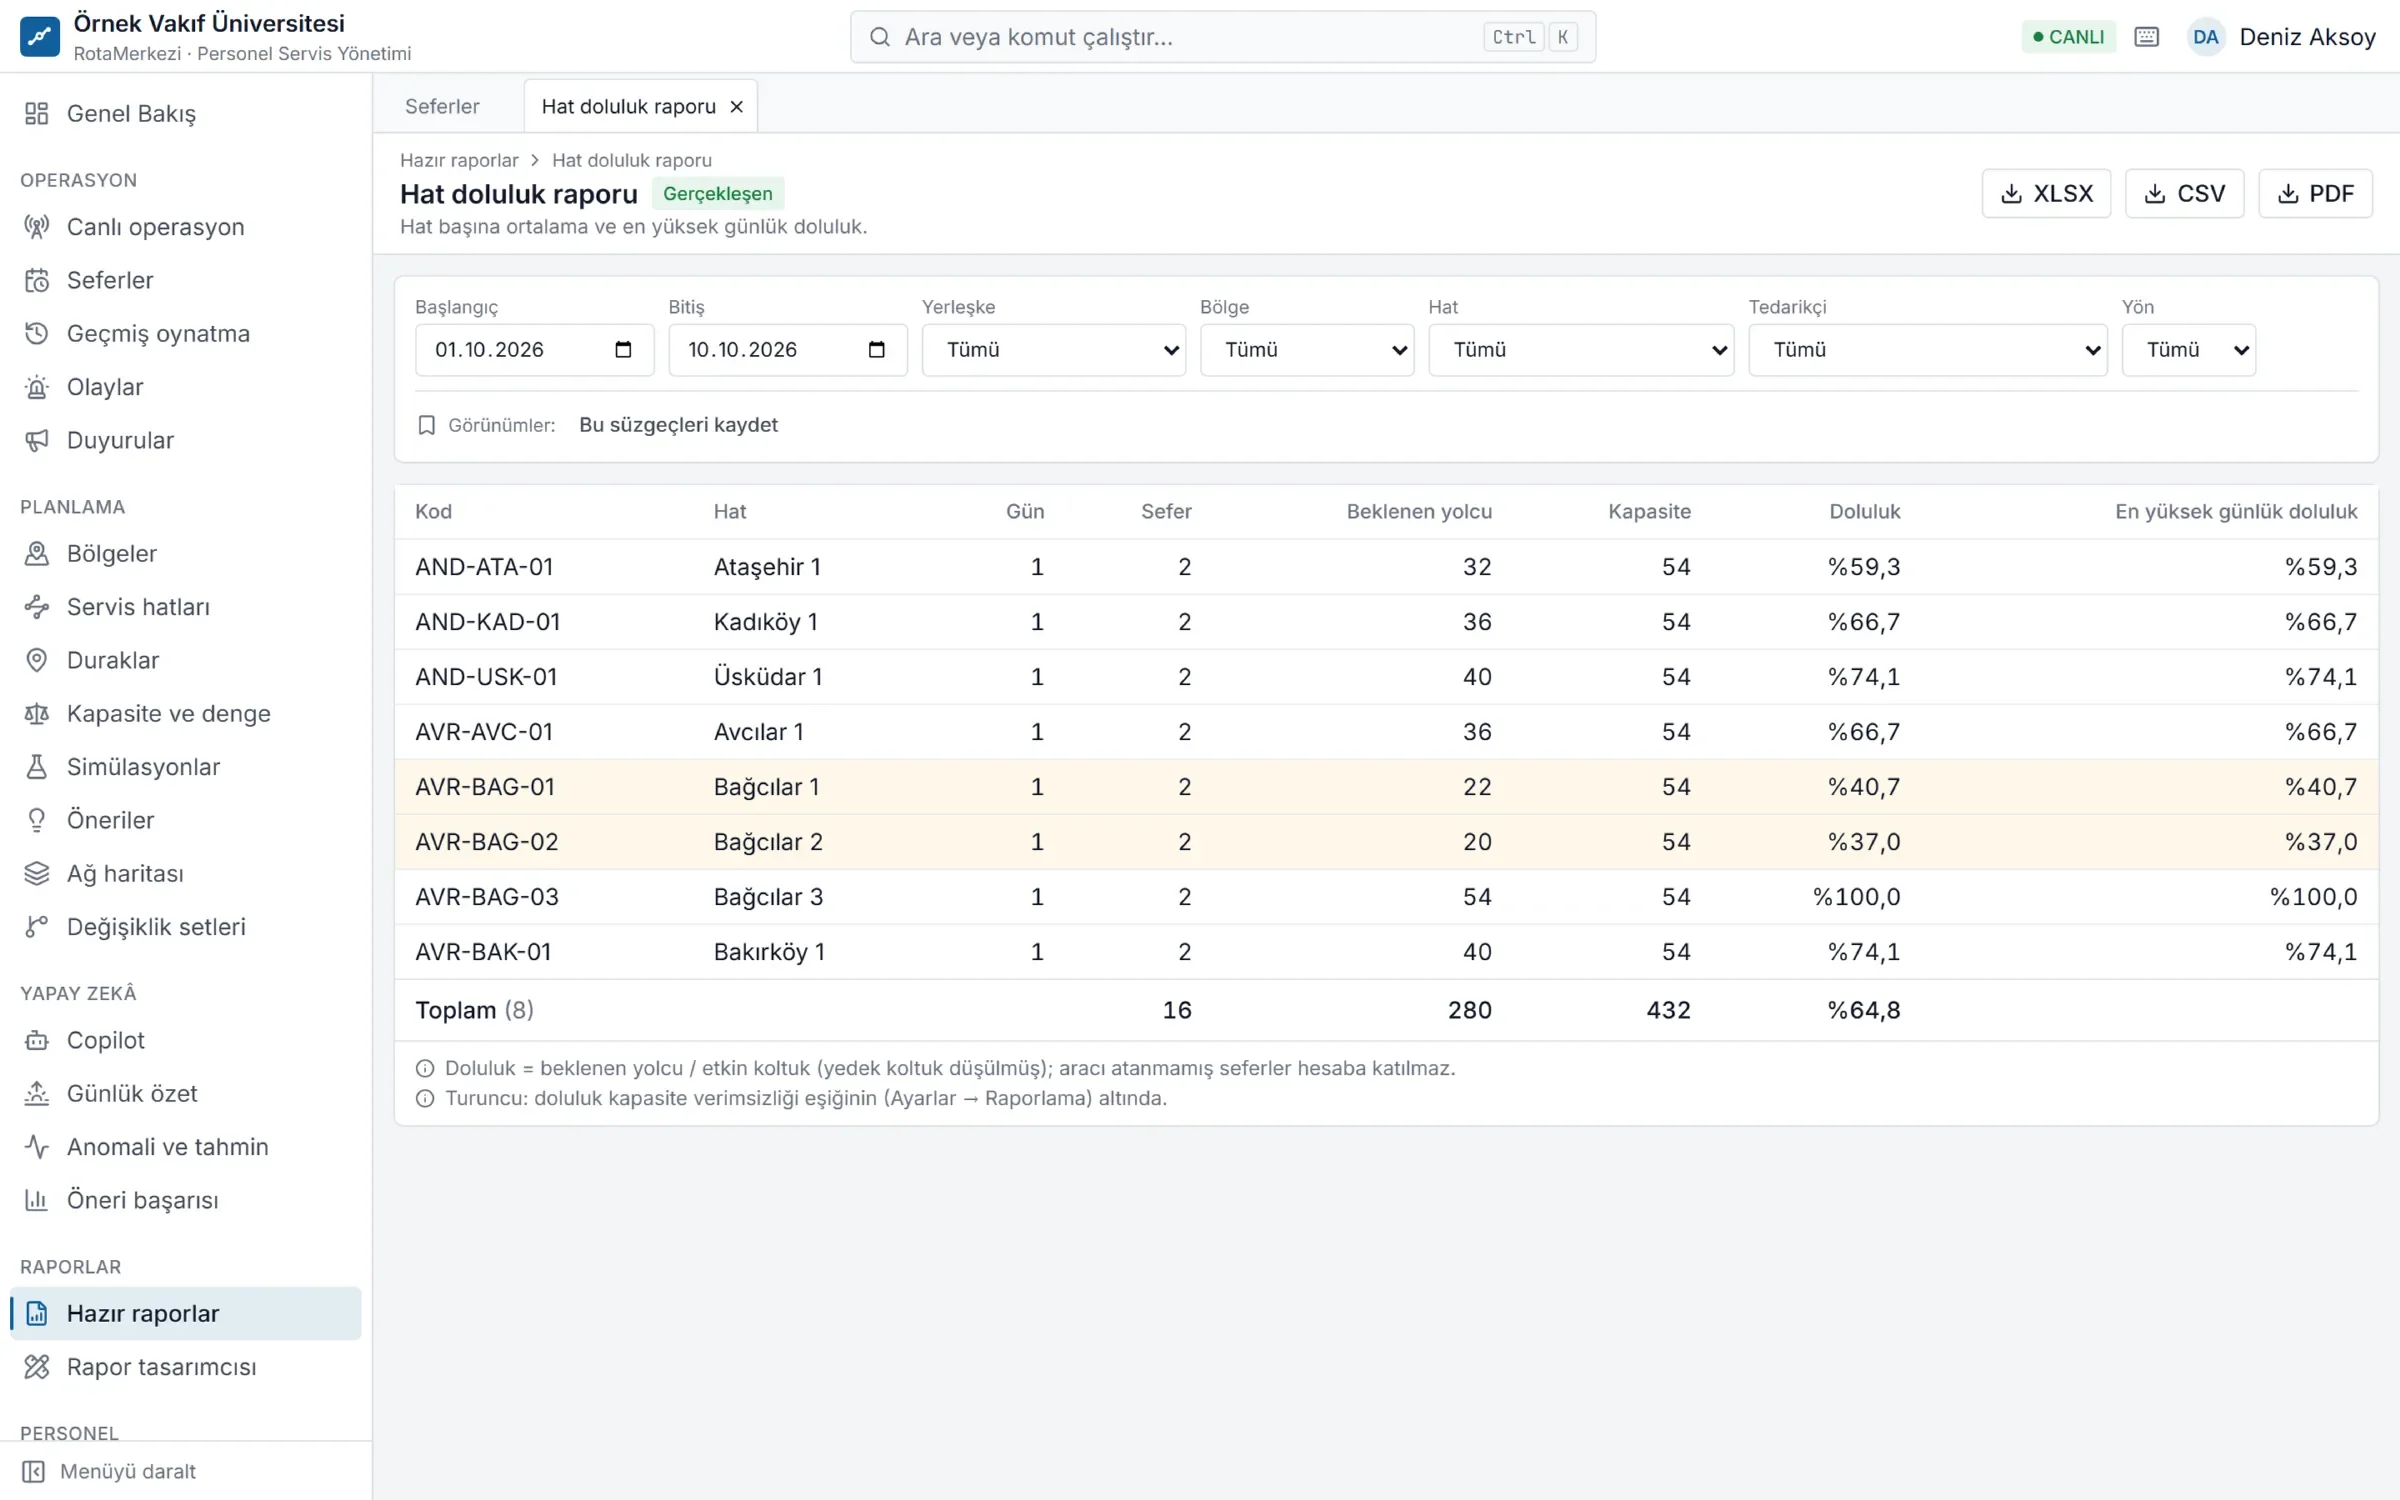
Management-ready indicators
- Line and vehicle occupancy, empty seat rate
- Punctuality and delay distribution
- Cost per employee, cost per line
- No-show rate and demand forecast
- Vendor performance and SLA
Report designer
Build your own reports by choosing fields, filters and grouping, then save them and share them with your team. All reports can be downloaded as Excel and PDF; indicators can also be fed into your BI tools through the open API.
18 ready-made reports
| Area | Reports |
|---|---|
| Service | Daily shuttle, line occupancy, capacity, region, employee–shuttle distribution, shuttle usage rate |
| Operations | Delay, route deviation, driver operations, vehicle utilization, morning / evening comparison, planned / actual, traffic impact |
| Cost and vendors | Cost analysis, vendor performance, SLA |
| Passengers | Stop usage, no-show |
Every report works with filters for date, campus, region, line, vehicle, driver, vendor, shift and direction. There is a totals row, column sorting and color-coded warning rows for situations such as overruns or inefficiency.
Data quality label
Every figure shows its source: actual (measured from trip and GPS records), estimated (calculated from planned values) or no data. No estimate is made up for an indicator that cannot be measured; for example, on trips without boarding tracking, the no-show rate is shown as "not enough data". It is always clear what a figure presented to management is based on.
Report designer details
- Choose up to three dimensions: date, week, month, day of week, line, region, campus, vendor, vehicle, direction.
- 17 measures: trips, punctuality, delay, passengers, capacity, occupancy, kilometers, deviation, incidents, cost, cost per passenger and per kilometer, empty seat cost and more.
- Instant preview, saving as personal or shared within the organization, export.
- There is no free-form SQL; only permitted fields can be used, and the user's data scope applies.
Performance and export
Indicators are precomputed every night by line × direction × day and refreshed hourly during the day, so reports open quickly even in large organizations. Exports are available as Excel (XLSX), CSV and PDF (with Turkish character support, landscape or portrait A4), and every export is written to the audit log. Filters can be saved by name and reused.
Privacy
In reports that come close to individuals, such as stop usage, counts below the privacy threshold are not shown. No-shows are reported only as aggregate statistics; no per-person "who didn't ride" list is produced.
Frequently asked questions
Which reports come ready-made?
There are 18 ready-made reports, including daily shuttle, occupancy, capacity, delay, route deviation, cost analysis, vendor performance, SLA, stop usage, no-show and planned / actual comparison.
Can we export reports to Excel?
Yes. All reports and views built with the report designer can be downloaded as Excel (XLSX), CSV and PDF.
Can we feed data into our own BI tool (Power BI, Tableau, etc.)?
Yes. Indicators and costs can be read through the open REST API with an authorized API key.
How up to date are the figures in the reports?
Today's indicators are recalculated hourly, previous days every night. For live status, the Live Operations Center shows real-time data.